
Whether you are budding a startup that has secured Series B funding or a global enterprise, it is likely that some or most of your routine financial reporting, planning, and analysis (FP&A) tasks are done in MS Excel.
As we have covered before (5 Tips For Better Using Excel), the traditional “Copy paste into Excel” approach is not suitable to handle processes that require extensive external data access as nearly every FP&A process does. As indicated from research, on average, a medium-sized organization (≈1000 employees strong) draws data from about 400 sources for business intelligence and analytics. So let’s say if 10-15% of these sources contribute data to FP&A tasks, imagine the complexity you’ll have to deal with when preparing and managing data through spreadsheets for effective business intelligence.
In such scenarios, a data model-driven approach is much more suitable. This approach, where Excel is just a container for automatically updating data, guarantees significant productivity gains, better insights and happier staff, not to mention avoiding very costly errors. The next question is, if Excel is still the best tool for the job and should you consider new self-service analysis solutions, that could do the job better?
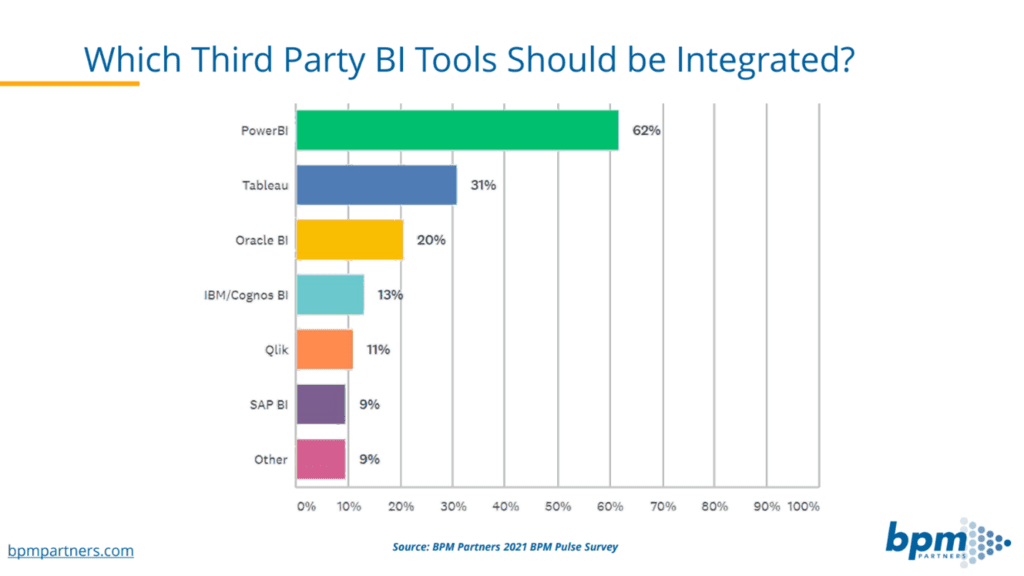
The obvious candidate here is Power BI. The self-service analytics solution that is now dominating in that space according to Gartner (Gartner Magic Quadrant Analytics) and also confirmed in studies among FP&A professionals as the most relevant tool considered.
In this article, we will do a Microsoft Power BI vs. Excel comparison in light of typical FP&A scenarios but first…
There are several reasons why you might want to switch from Power BI to Excel for financial planning. Perhaps the most important reason is that Excel is more customizable and flexible than Power BI. With Excel, you can create your own formulas and custom charts to suit your needs, while Power BI offers a limited number of options. Additionally, Excel is available on all platforms, while Power BI is only available on desktop and mobile devices. Finally, Excel is generally cheaper than Power BI, making it a more affordable option for small businesses and individuals.
There are a few reasons why you might want to switch from Excel to Power BI for financial planning. First, Power BI has a lot of built-in features that can make financial planning easier, such as the ability to create visualizations and reports. Additionally, Power BI is cloud-based, which means that you can access your data from anywhere and share your reports with other people easily. Finally, Power BI is often more comprehensive than Excel, making it a go-to tool for forecasting, planning, and analysis for bigger organizations.
Enterprise-Grade Planning & Reporting with Spreadsheet Ease in Excel
Manage planning processes with major ERP, accounting, SaaS and Power BI datasets with spreadsheet ease
Get Acterys Excel Add-inWhen talking about Power BI vs Excel, both tools can perform data analysis from various datasets and present the information in tables, visual charts and graphs.
Excel is a powerhouse when it comes to creating complex tabular reports and performing ad hoc or quick computations, thanks to its wide range of functions and expressions available. In contrast, Power BI’s strength lies in more extensive, interactive analytics capabilities.
While Excel and Power BI have some shared components e.g., the data modeling engine, there are very significant differences as well.
As such, each software makes for a better choice in specific scenarios, which we’ll explore in the light of key capabilities these tools offer to users.
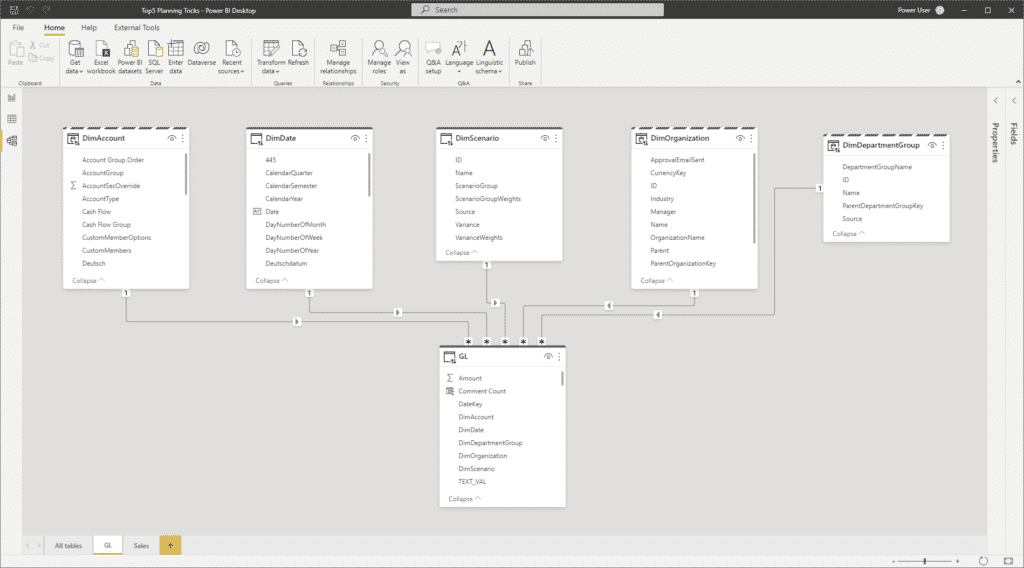
At the start of any reporting or analysis effort, the first step should be to build a data model that optimizes the data for the analysis process and integrates different sources. Taking a deeper look in Excel vs Power BI, the Power Query data modeling feature is available in both Excel and Power BI but works slightly differently. Let’s take a look:
A key differentiator of Power BI vs Excel is the structure of the data model: are you querying a single table or a full model with relationships between the tables. Both options Excel (Excel Data Model aka PowerPivot) and Power BI (Analysis Service) support a full relational (star schema) model (IMHO one of the biggest differentiators to Google Sheets which can’t offer anything similar).
The data model tables are limited in Excel by the number of Excel worksheet rows or by the capacity of the local data model (“Power Pivot”) associated with the workbook. There is no client-server support i.e., users cannot use the data model outside the workbook. For local requirements, Power BI Desktop also uses a local Analysis Services instance as the data storage engine in import mode (in live connect DirectQuery mode there is no limit) but it supports deploying the model to the Power BI service where it is available in a true client-server fashion. This means that users can access the model from other clients than the original Power BI desktop file, like in other Power BI reports or even from Excel.
Enterprise-Grade Planning & Reporting with Spreadsheet Ease in Excel
Manage planning processes with major ERP, accounting, SaaS and Power BI datasets with spreadsheet ease
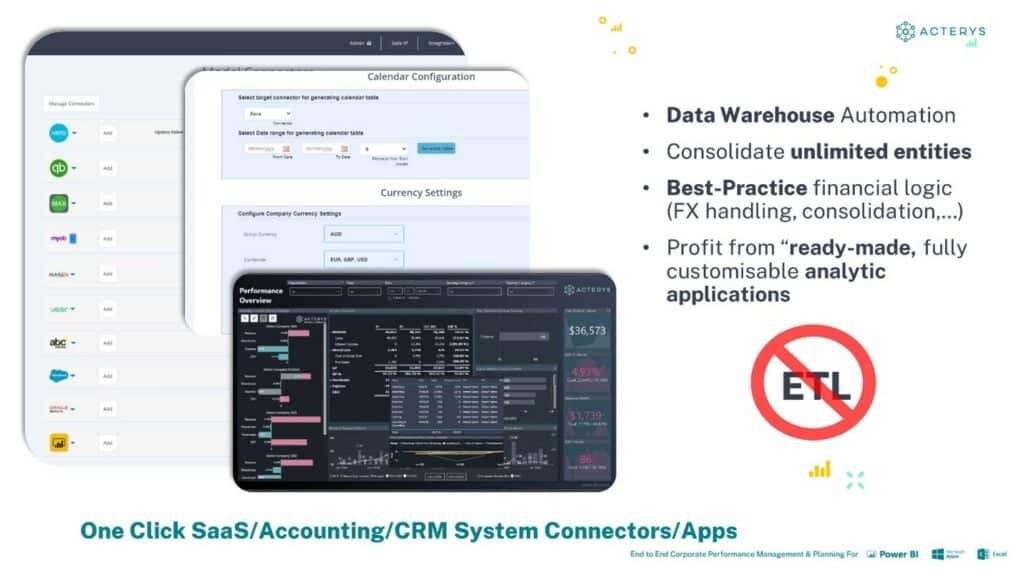
Get Acterys Excel Add-inDesigning an effective data model can be a very complex task that requires significant expertise of the modeler particularly in light of complex ERP systems and integrating other sources (CRM, POS, etc., etc.) into one data model. Solutions like Acterys Apps offer ready-made best practice data models even including Power BI and Excel reports and can help streamline this process.
Another difference between Excel and Power BI is that, over the years, Excel has evolved from just being able to copy-paste data from other workbooks and text files to offering native connectivity to import external data. Thanks to the Power Query feature, you can bring data from unstructured file formats, SQL and SAP databases, Azure cloud, and even from Power BI itself into Excel.
A key feature missing in the Excel data model standard Power Pivot -compared to Power BI- is the DirectQuery connection type. This allows you to connect to a source “live” and use the latest version of the data in reports without physically moving it into the data model.
Now, Power BI supports connectivity with hundreds of databases, cloud services, flat files, web apps & CRMs, OData feeds, and much more. The list is so long that Microsoft had to break it down into sections, sorted in alphabetical order, to make it easier to scour through it. It even supports connectivity using DirectQuery. The tool provides a single platform that can help create a centralized dashboard containing all your business KPIs, market trends, forecast projections, and more in a highly visual, interactive manner.
In summary:
In either case “having a connector” doesn’t mean you have the right data model immediately available. You will still need to invest significant work towards designing the right data model, integrating different sources and calculation logic.
Defining calculation logic is similar in Excel vs Power BI: both use the Data Analysis eXpression (DAX) language designed to write customized formulas and help perform aggregations. Certainly, a strong feature that enables defining logic within and across tables with mostly lightning-fast calculation times thanks to its intelligent compression capabilities.
Model results in Excel and Power Pivot need to be very critically reviewed from a security perspective: the data “lives in the workbook”.
Excel offers all the standard features to secure your files and their contents. You get file-level protection, which involves file encryption with a password, granting read-only access, and even controlling what users can do within a spreadsheet so that no important formula or data is deleted or changed. However, this level of security is just not enough when it comes to sensitive data, like customers’ personal or credit information.
From our practical experience of 20 years working with clients, very rarely appropriate security measures are set up for Excel workbooks. So, if someone has access to the workbook, they have access to all the data as there is no concept of granular security. In essence, you have the workbook; you have the data and that can be a massive amount of it. With Excel Data Model/ PowerPivot models, you can easily handle tens of millions of rows. Nice for the users from an analytics power perspective; not so nice when you can lose the entire underlying data set that’s now accessible to anyone with access to the workbook.
This is similar in Power BI’s import mode but very different when deployed on the Power BI Server where exact granular security rights can be defined using Row Level Security (RLS). In Direct Query mode, there is no data stored in Power BI: users require successful authentication with the underlying data source.
Some companies require time-sensitive data reporting. For example, NYSE or London Stock Exchange cannot afford to work with outdated data, as the market conditions change by the minute.
Unfortunately, there is no easy way to refresh data in Excel automatically. You have to use Visual Basic for Applications (VBA) and code to automate repetitive processes. And as you can imagine, when large datasets and multiple sources are involved, this could quickly become a time-consuming and overwhelming task.
On the other hand, when looking at Microsoft Excel vs Power BI, when real-time data updates are required, Power BI offers built-in features that make this task easy and manageable. It supports multiple ways to refresh data:
Storing the data in Excel is useful for smaller datasets and once-off requirements with less than 1 million records or are under 500 MB workbook size. Using the Excel Data Model (Power Pivot), limits greatly increase to potentially hundreds of millions of rows but in these regions, users will experience instabilities. Excel was never designed as a big data store.
Power BI excels in this area. The platform is built to handle Big Data, breaking the barriers to handle data far beyond these limits. We are talking about billions of records here. Thanks to its robust compression algorithms that intelligently reduce data size and cache it on Import, it adds immense value in enterprise environments that work in fast-evolving, dynamic markets.
If you want to implement a set of data governance policies and secure data on a granular level, Power BI offers several features to achieve that, such as:
You can even apply your governance policies when data is exported from Power BI and add sensitive content labels to critical data, giving your data reports the all-round security it needs.
While the difference between Excel and Power BI remain, both solutions offer very comprehensive collaboration options:
Excel offers live collaboration and great sharing capabilities e.g. Excel Online in the web browser respectively integrates with MS Teams. But as you can imagine, in an enterprise, there will be hundreds of such Excel files floating around in the cloud on SharePoint, making it difficult to dig out insights and collaborate on projects.
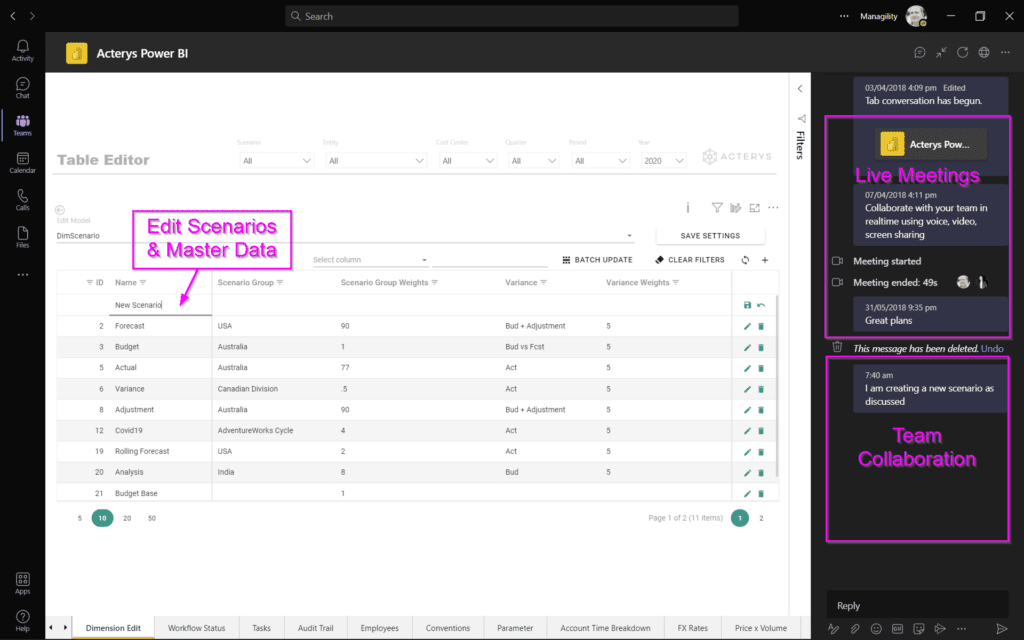
Power BI offers free options with Power BI Desktop and the ability to publish to the web. But both are not ideal from a security perspective. For secure sharing, with granular security, there is no alternative to the Power BI Service.
Power BI Service, enables users to publish data to their desired destination. You can publish single or consolidated reports and dashboards in any dedicated Workspace, allowing a group of people to access and work on it simultaneously. The added benefit is that once you have published your content, the Power BI service will refresh the data automatically, saving you and other team members from resharing it again and again.
Lastly, the Power BI service allows embedding your dashboards on online portals and websites, giving viewers interactive charts and graphs with the same ability to drill down into the data as you could from its app.
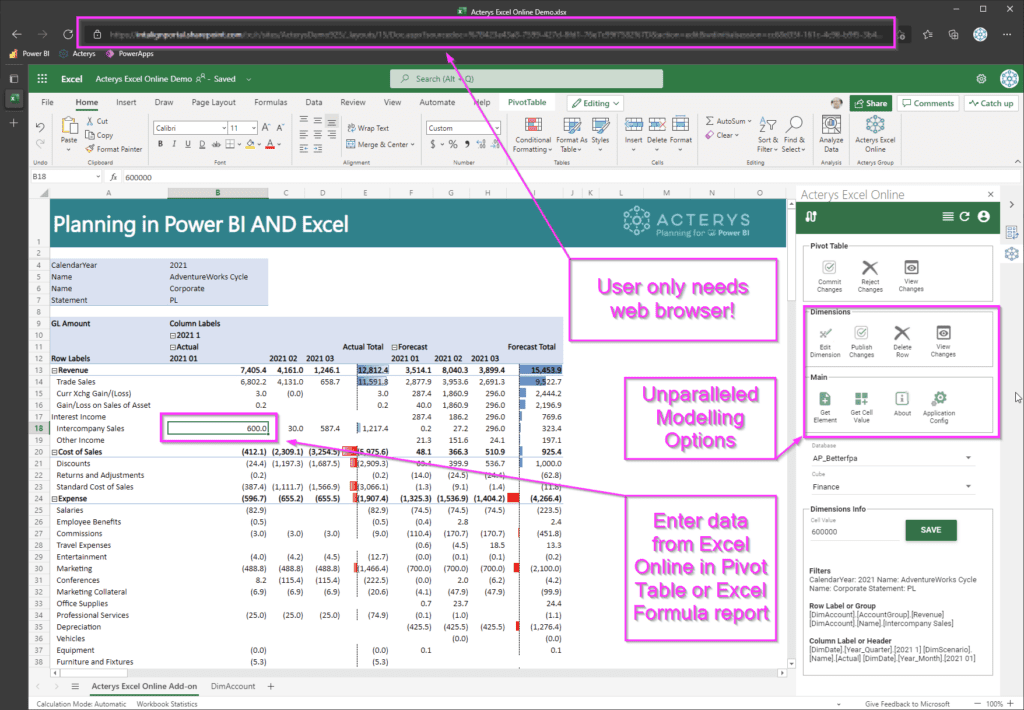
Data written back in Excel is by default stored in the workbook, which is often not optimal for analytics, reusing in other reports/tools and security/sharing. Instead, a central database is a much better option. Power BI also doesn’t offer write-back options by default. Both solutions can be extended with add-on solutions, like Acterys.
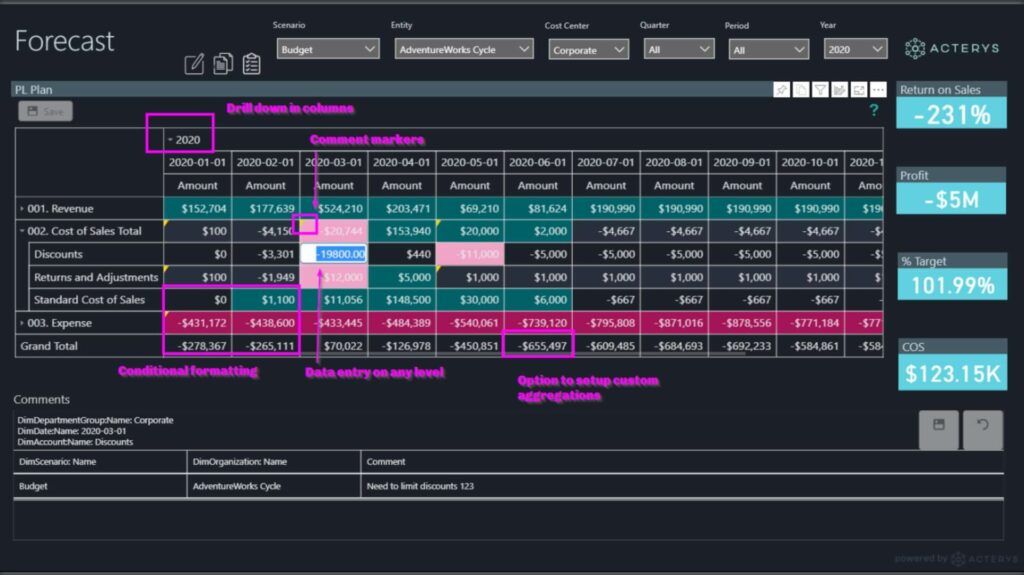
Acterys includes automatically generated data models from typically used accounting, ERP and SaaS solutions, respectively providing tools to easily generate them from any source. All of it is stored in a standard SQL database in the cloud, which is often already the standard in many organizations. With this data model, Acterys offers extensive planning, forecasting and write-back options with either 8 custom visuals in Power BI or the same with an add-on that works both in the Excel Desktop version and in Excel Online.
The key to success in today’s hypercompetitive markets is the ability to react to change and do it fast. With Power BI, you o get notified (both on the app and via email) when certain metrics or KPIs go below, above, or hit the set threshold. This allows you to take action to remediate the situation proactively before it can lead to any damages.
Let’s say you want to make sure that your overall marketing spending on the current campaign doesn’t go over $10,000. You can set an email alert that can notify you when it is about to hit that mark, allowing you to evaluate areas consuming your budgets and optimize your spending accordingly.
This feature is not available in Excel, so it is a solid point for Team Power BI.
Being around for more than 3 decades as part of the Office suite, we already have several generations of Excel users using it for reporting and data analysis. The familiar interface and easy-to-implement processes, like using mathematical formulas on datasets, building pivot tables, and creating graphs, add up to its excellent usability.
Power BI offers a drag-and-drop interface that makes building dashboards and reports easy and fun.
However, to unlock the true power of both these tools, it is recommended to dive deeper into a roster of advanced features. A few of these include Power Query, Power Pivot, DAX language, setting up different visuals, and the data refreshing and sharing processes, among others.
Finally, Microsoft Excel vs Power BI really boils down to your organization’s use case. In my opinion, a smart “synergetic” use that builds on the same live connection to datasets (as opposed to offline “Copy/paste”!) from both tools is the optimal strategy.
As a guide for when to use what, I propose to ask the following questions:
If you’ve nodded yes to half of these questions, the scales are likely to tilt toward Power BI.
If you are interested in automating data models from ERP, CRM and SaaS systems and adding write-back and planning capabilities to Power BI & Excel request an onboarding session with our solution experts.
Need Tailored Reporting, Planning & Analytics Solutions?
Talk to our solution experts now
Book a MeetingPower BI has robust interactive analytics features, extensive data source connectivity, adept handling of large datasets, and real-time data update options. Power BI’s advanced security measures, including cloud-based provisions, role-based authentication, and row-level security, enhance data governance. These features make Power BI particularly well-suited for organizations with complex data needs and stringent security requirements.
2. How does Power BI handle data model generation differently compared to Excel?
Power BI supports a full relational (star schema) model, making it ideal for integrating complex data from multiple sources. Moreover, Power BI allows for deployment to the Power BI service, enabling client-server access to the model. In contrast, Excel’s data model is limited by the capacity of the local data model associated with the workbook, making it less suitable for large-scale data integration.
3. What are the advantages of using Power BI for real-time data updates and streaming compared to Excel?
Power BI provides built-in features like live streaming services and automatic refresh settings, allowing users to keep data up-to-date with ease. Excel, on the other hand, necessitates manual coding in VBA for automating data refresh, which can be cumbersome and time-consuming, particularly when dealing with large datasets and multiple sources.
4. What security and governance features does Power BI offer that Excel lacks for FP&A tasks?
Power BI provides comprehensive security and governance features, including cloud-based security provisions, role-based authentication, row-level security, and session monitoring. In contrast, Excel’s security measures are often inadequate for safeguarding sensitive data due to a lack of granular security options. This makes Power BI a more suitable choice when strict data security and governance policies are essential for FP&A tasks.
© 2024 Managility Pty Ltd All rights reserved.